Sunday, December 7, 2014

Period of a Isosceles Triangle

Purpose
We had to calculate the period of an isosceles triangle where the pivot is at the base and on its top point and compare it to our experimental value
Procedure
The set up at the top point of the isosceles triangle
What we used:
  • logger pro + photogate
  • styrofoam cut out of an isosceles triangle 
What we did:
  1.  first we had to calculate what the theoretical value of the period would be for both cases
    • we had to calculate for the center of mass for the isosceles triangle
  2. then logger pro and the photo-gate were set up
  3. the pivot is then placed at one of the locations (centered base or the top point) of the isosceles triangle
  4. the period is measured 
Data
isosceles triangle measurements
  • base: 0.10 m
  • height: 0.14 m
This is the period for the isosceles triangle at its base: 0.664. The period for the isosceles triangle at its top point is 0.591
Data Analysis / Calculations
This is the calculations for the center of mass for the isosceles triangle in the y-direction

This is the calculations for the periods of the isosceles triangle based on where the pivot is


Summary
In this lab we aimed to find the period of an isosceles triangle at its top point and at its center base. We found the theoretical value of the period and then did the experiment. 
When it was at its base, the theoretical value was 0.664 while the calculated value was 0.664, so that was a success. 
When it was at its top point, the theoretical value was 0.591 while the calculated value was 0.564, so there was about a 4% error, when we were supposed to get within 1%. 

Period of a Semicircle

Purpose
We had to calculate the period of a semicircle where the pivot is at the base and on its top point and compare it to our experimental value
Procedure
What we used:
  • logger pro + photogate
  • styrofoam cut out of a semicircle 
What we did:
  1.  first we had to calculate what the theoretical value of the period would be for both cases
    • we had to calculate for the center of mass for the semicircle first
  2. then logger pro and the photo-gate were set up
  3. the pivot is then placed at one of the locations (centered base or the top point) of the semicircle
  4. the period is measured 
Data
This is the graph for the period of the semicirle
Data Analysis / Calculations 
The calculations for the center of mass of the semicircle in the y direction. The center of mass in the x direction is given by symmetry.
 Summary 

Mass-Spring Oscillations

Purpose
We had to calculate the period of a mass-spring system
Procedure
What we used:
  • logger pro + motion sensor
  • spring
  • hanging mass(es)

What we did:
  1.  first we had to calculate what the spring constant of our spring
  2. then logger pro and the photo-gate were set up
  3. the pivot is then placed at one of the locations (centered base or the top point) of the semicircle
  4. the period is measured

Data
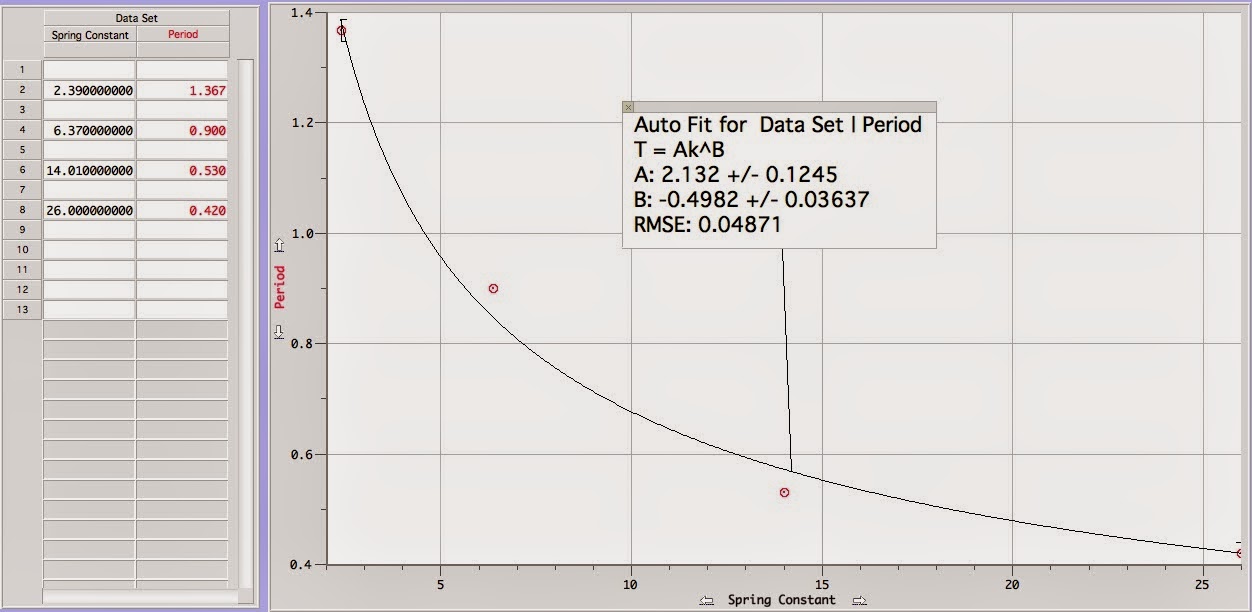
This is the data (right side) to help with finding the period vs spring constant  
Data Analysis / Calculations
We found the spring constant by measuring the height away from the motion sensor when the spring has a given hanging mass and the distance away with a different hanging mass. We then took the difference of the hanging masses and the displacement. We then found k through its relationship of F vs x. 
How we calculated for our spring constant
The expressions for what the period should be. Period vs Mass T = 1.678 m ^ 0.5 and Period vs Spring Constant T = 2.07 k ^ (-0.5)
This is the graph for the Period vs Mass. T = 1.971 m ^ (0.5556)

This is the graph for the Period vs Spring Constant. T = 2.132 k ^ (-0.4982)

Summary
In the lab, our results came close the calculated values. We calculated period vs mass T = 1.678 m ^ 0.5 and our experimental expression came out to be T = 1.971 m ^ (0.5556). For period vs spring constant we calculated T = 2.07 k ^ (-0.5) and in the experiment we got  T = 2.132 k ^ (-0.4982)
Our results came close to the calculated values that we can call the experiment a success. 

Saturday, November 22, 2014

Angular Momentum

Purpose 
To determine the height the meter stick reaches after colliding with the clay through using the conservation of energy and momentum and doing it experimentally. 
Procedure + Lab Equipment
What we used:
  • meter stick
  • clay
  • video camera
  • logger pro
  • ring stand
What we did:
  1. we took measurements of the meter stick and clay
  2. we calculated how how the meter stick would reach after collision
  3. we set the meter stick on the ring stand and the clay at the appropriate spot 
  4. we used the video camera to record a video to analyze how high the meter stick actually reached
Data
(M) mass of meter stick: 0.083 kg
(m) mass of clay: 0.01592 kg
(H) initial height: 1.135 m (this is when the meter stick is parallel with the floor)

Data Analysis + Calculations 
These are the calculations for the expected height that the meter stick will reach 
We expect the meter stick to reach a height of 0.6045 m
This is the video analysis for the experimental height the meter stick reached
The y-axis gives us the height reached, which is 0.7642 m
Summary
In our lab, we used the conservation of energy and momentum to help us determine the height that the meter stick would reach after colliding with the clay. Our calculated height was 0.6045 m while our experimental height was 0.7643m. Our percent error was about 26%, more than the accepted value. 
What might have gone wrong in the experiment is that the meter stick didn't start exactly at the end, we also didn't measure the initial height for this video capture. What we did was measure the initial height once when it was horizontal, but not through each video capture. We also don't account for friction or air resistance as the meter stick swings.

Triangle's Moment of Inertia (about its center of mass)

Purpose
In this lab, we were looking to find the moment of inertia of a triangle about its center of mass

Procedure + Lab Equipment
What we used:
  • rotating apparatus
    • disks
    • hanging mass
    • torque pulley
    • hanging mass
  • triangle
  • holder for triangle
  • caliper to measure
 What we did:
  1. we took measurements of the triangle
  2. we set the rotating apparatus with a hanging mass took angular acceleration of the rotating apparatus without the triangle, with the triangle on its base, and on its height
  3. we calculated the moment of inertia by experiment using angular acceleration and by calculations using calculus
 
This is the setup for the disks and holder only
This is the setup for when the triangle is on its base

This is the setup for when the triangle is on its height
Data
This is the angular acceleration for the disks with the holder


Data Analysis + Calculations
Calculations for the moment of inertia of a triangle about its center when its on its base 
Calculations for the moment of inertia of a triangle about its center when its on its height

Friday, November 21, 2014

Moment of Inertia

Angular Acceleration

Purpose
We are looking at how the angular acceleration is affected by changing the:
  • hanging mass
  • torque pulley
  • disks
Procedure + Lab Equipment
What we used:
  • rotating apparatus
    • aluminum disk
    • steel disk (2)
    • small torque pulley
    • large torque pulley 
    • hanging mass
  •  caliper to measure disk + pulley diameters
  • logger pro
What we did:
  1.  took measurements of the disks and pulleys
  2. set up the apparatus 
    1. cleaned the disks with alcohol
  3. set up logger pro
    • sensor set to rotary motion
    • data set to 200 counts per rotation
  4. turned the compressed air on
    • check to see if everything's in order
  5. let the hanging mass go 
    • collect data
Data
The slopes of each graph were found to determine the angular acceleration. These were from using the small pulley.
The slopes of each graph were found to determine the angular acceleration. These were from using the large pulley.
These are the angular accelerations for each experiment
 Data Analysis + Calculations
Hanging Mass
When we look at experiments 1, 2, and, 3, the hanging mass was only changed. Given the angular accelerations, we conclude that when the hanging mass is increased so is the angular acceleration. Based on the observations we also see that as the hanging mass was doubled, the angular acceleration doubled as well. The same thing happened when the hanging mass was tripled, the angular acceleration tripled as well. 
 Torque Pulley
When we look at experiments 1 and 4 (where experiment uses the small pulley and experiment 4 uses the large pulley) we find that the size of the torque pulley was only changed. Based on the experiment, the angular acceleration was increased as the size of the torque pulley was increased. When comparing the size of the torque pulleys, we found that the size was doubled, as well as the angular acceleration. 
Disks Mass
When we look at experiments 5 and 6, where only the mass of the disks is changed, we find that as the mass increased the angular acceleration decreased - unlike with increasing the hanging mass and the torque pulley.
Summary
In this lab, we experimented to see how the angular acceleration would be affected by changing the hanging mass, the size of the torque pulley, and the mass of the disks. We found that each factor has a different affect on the angular acceleration of the system.

Wednesday, October 22, 2014

Thursday, October 16, 2014

Lab 11: Impulse-Momentum Theorem 10/13

Purpose
In this lab, we wanted to test if the impulse-momentum theorem is true - that impulse is equal to the momentum.
Procedure + Lab Equipment
What we used:
  • track
  • cart
  • clay + nail
    • the clay was placed on a wooden block and the nail on the force sensor - this was for the inelastic collision
  • logger pro 
    • force sensor + motion sensor
What we did:
Part 1 - Elastic Collision (bouncing)
  1. on one end of the track, a spring was placed at the end 
  2. at the other was the motion sensor
  3. the force sensor was attached to one end of the cart
  4. the cart with the force sensor is then weighed
  5. the force sensor was calibrated and then placed on the cart
  6. data was collected as the cart is pushed into the spring
  7. this is repeated with an additional mass on the cart
Part 2 - Inelastic Collions
  1.  the same as part one, except the spring is changed with clay
  2. a nail is attached to the end of the force sensor
Data
Part 1 -Elastic Collision
This is the data for the cart
This is the data for the cart with an additional mass
 Part 2 - Inelastic Collision
This is the data for when the cart collides with the clay
Calculations + Data Analysis
Using the equations of momentum, we were able to calculate the momentum of the cart and compare it to the impulse of the cart.
Conclusion
We found that the theorem is true....

Tuesday, October 14, 2014

Lab 10: Magnetic Potential Energy 10/8 - 10/13

Purpose
In this lab, we are using the relationship between force and distance to find the potential energy of the magnet and see that the conservation of energy applies to this system as well.


Procedure + Lab Equipment
What we used:
  • air track + vacuum
  • glider cart
  • angle reader 
  • motion sensor
What we did:
  1. We placed the air track at an angle (day 1)
    • we let the glider go measured how far away the glider was from the  magnet
    • we repeated this step at different angles for a total of 5x
  2. We  leveled the track and then gave the glider a push toward the magnet (day 2)
Data
The graph is the relationship between the force and the distance
This graph shows how as the angle of the ramp is increased, the force increases as well, and the distance between the magnets decreases. This force and distance relationship helps us in finding the potential energy as a function of distance. So as the distance between the magnet changes, so does the potential energy. 
This is the data for the cart when the track is leveled
This is the data collected for the cart as it approached and moves away from the magnet.
Calculations + Data Analysis
This is the data for energy at each point
This is the graph that shows the PE and KE as the glider approaches and then moves away from the magnet.


Summary


Monday, October 6, 2014

Lab 9: Conservation of Energy in a Mass-Spring System 10/6

Purpose
In this lab, we measured the kinetic energy (KE)  and gravitational potential energy (GPE) for the mass and spring, and elastic potential energy (EPE) for the spring to verify that energy is conserved through out the system.
Procedure + Lab Equipment
What we used:
  • ring stand + clamp
  • spring
  • mass
  • ruler
  • logger pro 
    • motion sensor + force sensor
This is the lab set up for when the spring is stretched, below is the motion senor
What we did: 
  1.  we used the motion sensor to record the height of the spring when it was not stretched and when it was stretched
  2. we attached the top end of the spring to the force sensor and hung the mass at the other end of the spring
  3. we weighed the spring 
  4. we then took the final reading as the mass was hung on the spring
Data
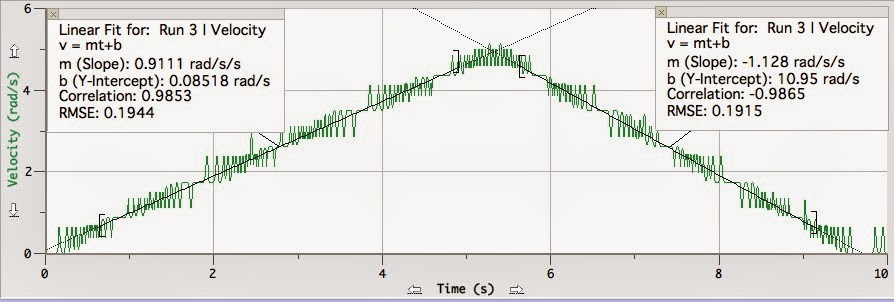
With logger pro, we were able to record the velocity of the spring as it moved
This is the height without and with the mass, and the mass of the spring is 0.044kg
The slope is the k constant of the spring
show integration work 
Calculations + Data Analysis
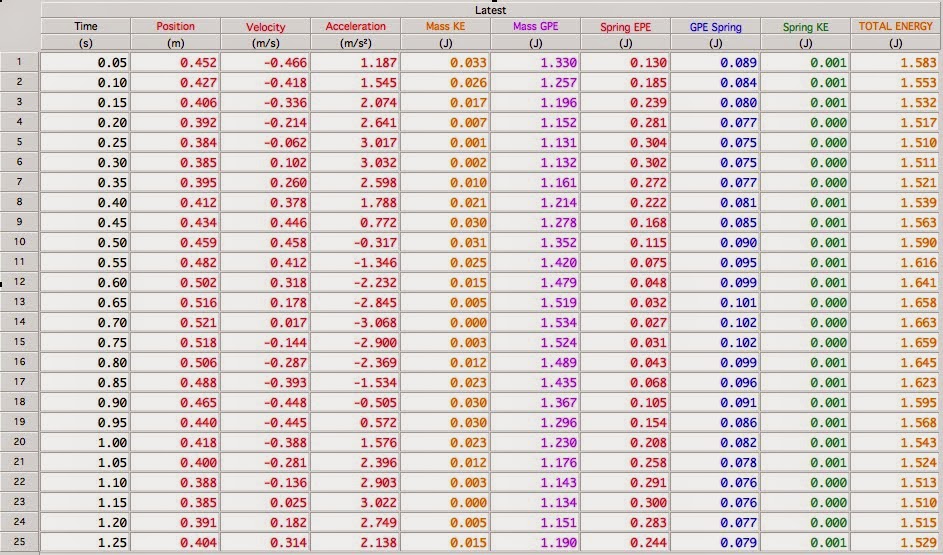
The data table that calculates KE, GPE, EPE, and Total Energy at each point as the spring oscillated from stretched to not stretched
This is the data table we created to find KE,  GPE, and EPE of the mass and spring at each point as the spring oscillated between stretched and not stretched. We then took those numbers and created a column for the total energy at each point. From the data table we see that the total energy through out the system appears to be consistent. 
From this graph we can see that when the spring is stretched, the total energy stays consistent, unlike when it bounces back up.
From this graph, we can actually see a clearer picture-that energy is consistent at every point as the spring goes from not stretched to stretched.
Summary
In this lab, we wanted to verify that in a mass-spring system, that the conservation of energy was true. We used logger pro to measure the velocity and position over a period of 10 seconds to help us find the energies at each point. Our graph showed that the energy was consistent throughout those 10 seconds, so, we were able to verify the conservation of energy in a mass-spring system.

Friday, October 3, 2014

Lab 8: Work-KE Theorem 10/1 - 10/6

Purpose
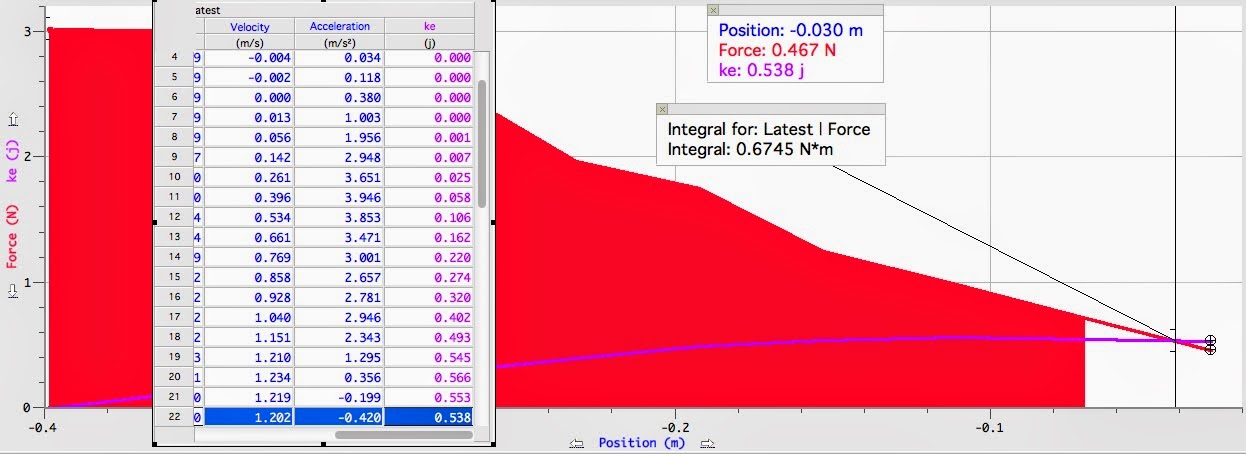
In this lab, we wanted test our hypothesis that, based on the work-kinetic energy theorem, the work done on the spring is equal to the kinetic energy of the spring.
Procedure + Lab Equipment
What we used:
  • cart + block
  • ramp
  • spring
  • logger pro
    • force sensor + motion sensor 
This is the lab set up for the experiment when the spring is at rest
What we did:
  1. the mass of the cart + block was measured
    • attached one end of the spring to the cart
  2. calibrated the force sensor
    • we then connected the force sensor to the other end of the spring and let the spring at rest and zeroed
  3. stretched the spring and let go - recorded the data
Data
Graph 1
Graph 2
Graph 3
Graph 4
Calculations + Data Analysis
Kinetic energy is found through... 
This is how the kinetic energy is found.
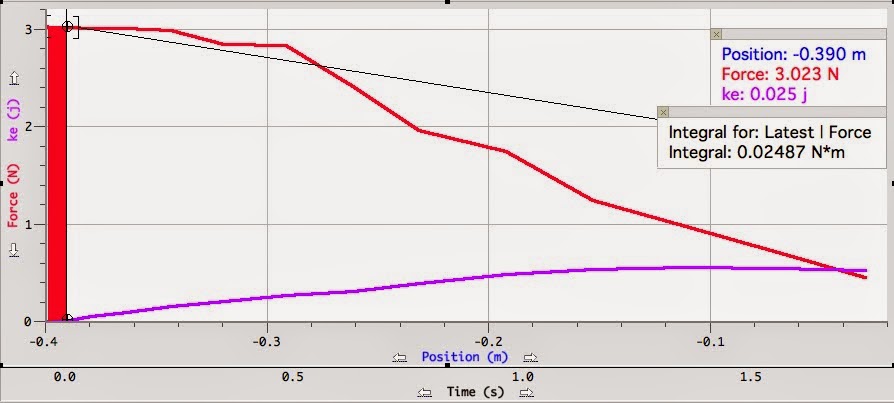
These are the percent errors for their respective graphs
We can see that throughout the graph, work is close to equal to the kinetic energy. So, we found that the work-kinetic theorem to be true.  
Summary
In this lab, we set out to test if the work-kinetic energy theorem is true. We used a cart-spring system to see if the work done was equal to the kinetic energy. Our data shows that work was close to equal to the kinetic energy. We aren't going to get exact numbers due to some errors. Our spring was resting on something, as can be seen in the lab set up. This may have affected our data. 
Though are numbers weren't exact, they did let us see that the work-kinetic energy theorem works.