Sunday, December 7, 2014

Period of a Isosceles Triangle

Purpose
We had to calculate the period of an isosceles triangle where the pivot is at the base and on its top point and compare it to our experimental value
Procedure
The set up at the top point of the isosceles triangle
What we used:
  • logger pro + photogate
  • styrofoam cut out of an isosceles triangle 
What we did:
  1.  first we had to calculate what the theoretical value of the period would be for both cases
    • we had to calculate for the center of mass for the isosceles triangle
  2. then logger pro and the photo-gate were set up
  3. the pivot is then placed at one of the locations (centered base or the top point) of the isosceles triangle
  4. the period is measured 
Data
isosceles triangle measurements
  • base: 0.10 m
  • height: 0.14 m
This is the period for the isosceles triangle at its base: 0.664. The period for the isosceles triangle at its top point is 0.591
Data Analysis / Calculations
This is the calculations for the center of mass for the isosceles triangle in the y-direction

This is the calculations for the periods of the isosceles triangle based on where the pivot is


Summary
In this lab we aimed to find the period of an isosceles triangle at its top point and at its center base. We found the theoretical value of the period and then did the experiment. 
When it was at its base, the theoretical value was 0.664 while the calculated value was 0.664, so that was a success. 
When it was at its top point, the theoretical value was 0.591 while the calculated value was 0.564, so there was about a 4% error, when we were supposed to get within 1%. 

Period of a Semicircle

Purpose
We had to calculate the period of a semicircle where the pivot is at the base and on its top point and compare it to our experimental value
Procedure
What we used:
  • logger pro + photogate
  • styrofoam cut out of a semicircle 
What we did:
  1.  first we had to calculate what the theoretical value of the period would be for both cases
    • we had to calculate for the center of mass for the semicircle first
  2. then logger pro and the photo-gate were set up
  3. the pivot is then placed at one of the locations (centered base or the top point) of the semicircle
  4. the period is measured 
Data
This is the graph for the period of the semicirle
Data Analysis / Calculations 
The calculations for the center of mass of the semicircle in the y direction. The center of mass in the x direction is given by symmetry.
 Summary 

Mass-Spring Oscillations

Purpose
We had to calculate the period of a mass-spring system
Procedure
What we used:
  • logger pro + motion sensor
  • spring
  • hanging mass(es)

What we did:
  1.  first we had to calculate what the spring constant of our spring
  2. then logger pro and the photo-gate were set up
  3. the pivot is then placed at one of the locations (centered base or the top point) of the semicircle
  4. the period is measured

Data
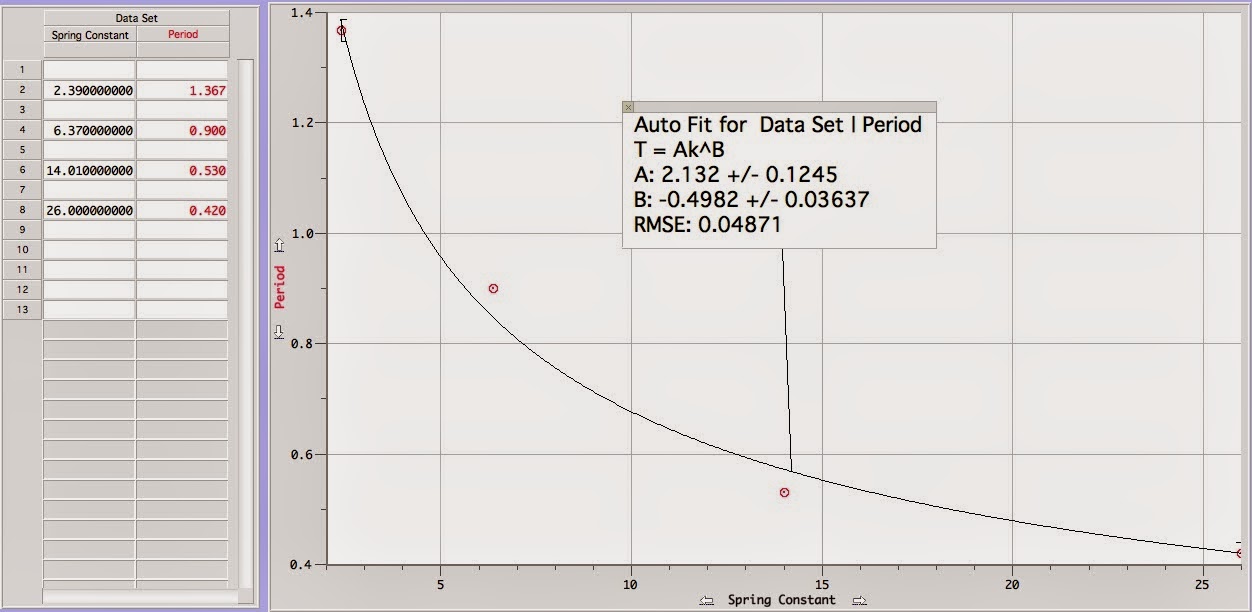
This is the data (right side) to help with finding the period vs spring constant  
Data Analysis / Calculations
We found the spring constant by measuring the height away from the motion sensor when the spring has a given hanging mass and the distance away with a different hanging mass. We then took the difference of the hanging masses and the displacement. We then found k through its relationship of F vs x. 
How we calculated for our spring constant
The expressions for what the period should be. Period vs Mass T = 1.678 m ^ 0.5 and Period vs Spring Constant T = 2.07 k ^ (-0.5)
This is the graph for the Period vs Mass. T = 1.971 m ^ (0.5556)

This is the graph for the Period vs Spring Constant. T = 2.132 k ^ (-0.4982)

Summary
In the lab, our results came close the calculated values. We calculated period vs mass T = 1.678 m ^ 0.5 and our experimental expression came out to be T = 1.971 m ^ (0.5556). For period vs spring constant we calculated T = 2.07 k ^ (-0.5) and in the experiment we got  T = 2.132 k ^ (-0.4982)
Our results came close to the calculated values that we can call the experiment a success.